The Situation
Craig runs a 5-bay independent garage on the outskirts of Bristol. The workshop handles a mix of general servicing, repairs, MOTs and diagnostics with five technicians working Monday to Friday. On paper, the capacity is 200 bay-hours per week — five bays, eight hours a day, five days a week.
In practice, Craig estimated the workshop was running at roughly 65% utilisation. On any given day, at least one bay was empty for extended periods — sometimes two. Jobs overran into the next slot. Technicians waited for parts that hadn't been pre-ordered. Short jobs were booked into long slots and long jobs squeezed into short ones.
The Problem
The scheduling issues were systemic, not individual. Every one was caused by a lack of visibility:
- No bay-level scheduling — the whiteboard diary showed jobs by time but not by bay. The workshop manager allocated bays verbally each morning based on what felt right. Two technicians regularly clustered on the same bay type while others sat idle.
- No estimated duration on bookings — a full service and a set of brake pads both appeared as a single line on the whiteboard. One takes 90 minutes, the other takes 3 hours. The next job was booked based on the slot, not the actual time needed.
- No parts pre-ordering — parts weren't linked to bookings. Technicians discovered what was needed when the car was on the ramp, then waited 30–60 minutes for delivery. The bay sat occupied but unproductive.
- No real-time job status — nobody knew if a bay was finishing early until the technician walked to the front desk. Gaps appeared and disappeared with no way to fill them.
- No data on where time was lost — Craig had a feeling things were inefficient, but no numbers to prove it or identify where the waste actually occurred.
Bay Utilisation — Before
In the first week on My Garage CRM, Craig tracked actual bay utilisation — hours each bay was actively working on a vehicle versus hours it sat empty:
Overall utilisation: 64.2%. Bays 4 and 5 were below 55% — effectively idle for nearly half of every working day. The MOT bay ran highest because it had the most structured booking pattern. The general bays performed mid-range. The heavy repair and diagnostics bays were dramatically underutilised.
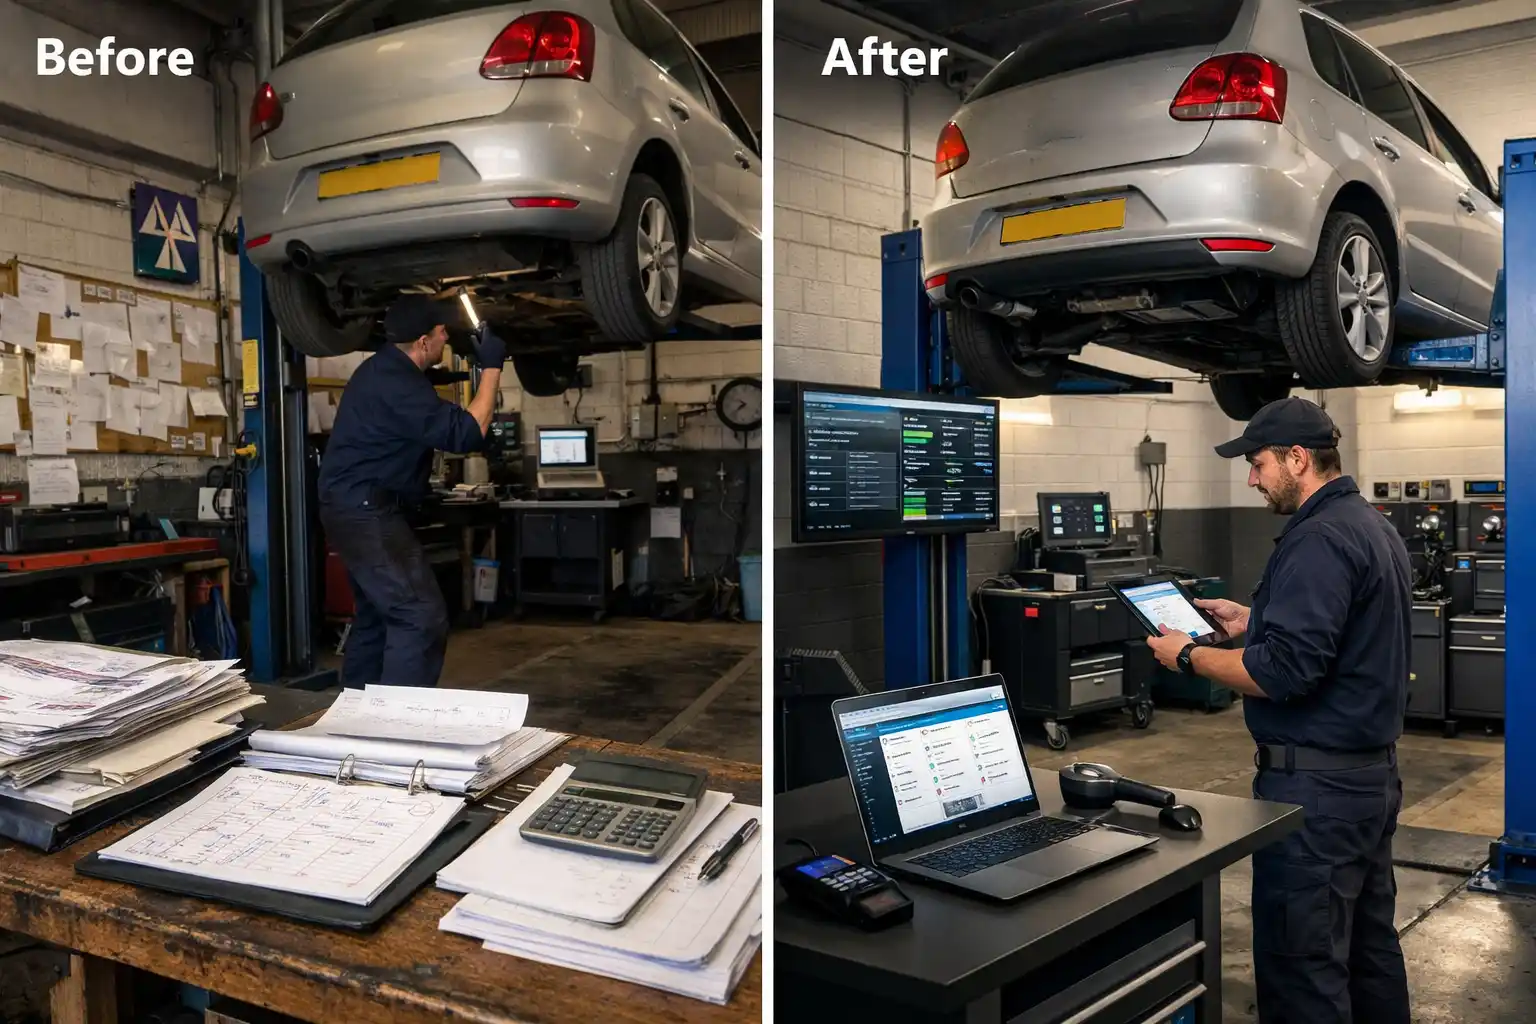
What Changed
The diary system in My Garage CRM replaced the whiteboard with four key differences:
1. Bay-level scheduling
Every booking is now allocated to a specific bay at the point of booking — not verbally assigned on the morning. The diary shows all five bays in columns with time slots, so the receptionist can see exactly where capacity exists before confirming a booking.
2. Estimated job duration
Each service type has a default duration. A full service is booked as a 2-hour slot. Brake pads are 1 hour. A timing belt is 4 hours. The diary reflects the actual time a bay will be occupied, not just that a job exists.
3. Parts pre-ordering linked to bookings
When a job is booked, the required parts are flagged. The receptionist orders parts in advance so they're on the shelf before the car arrives. The 30–60 minute mid-job wait for deliveries — with the bay occupied but unproductive — was eliminated almost entirely.
4. Real-time job progress
Technicians update job status on a tablet as they work. The workshop manager can see which bays are finishing early and redirect walk-in work or bring forward the next booking. Gaps are filled as they appear rather than discovered retrospectively.
Bay Utilisation — After 8 Weeks
Overall utilisation: 82.4% — up from 64.2%. Bay 4 jumped from 52% to 78%. Bay 5 from 48% to 73%. The improvement came from better allocation, accurate time estimates, and pre-ordered parts eliminating mid-job downtime.
Before and After
❌ Before
- Whiteboard diary — no bay-level view
- Verbal bay allocation each morning
- No job duration estimates on bookings
- Parts ordered mid-job — 30–60 min waits
- No real-time job status visibility
- 64.2% average bay utilisation
- ~76 jobs per week
✅ After
- Digital diary with 5 bay columns
- Bay allocated at point of booking
- Duration-based scheduling per service type
- Parts pre-ordered — on shelf before car arrives
- Real-time status updates from tablets
- 82.4% average bay utilisation
- ~93 jobs per week
Results After 8 Weeks
Throughput
Weekly job count increased from approximately 76 to 93 — 17 additional jobs per week. This was achieved without hiring additional staff, extending opening hours, or adding equipment. The capacity was always there — it just wasn't being used.
Parts waiting time
Mid-job parts delays dropped by approximately 80%. Parts are now linked to bookings and pre-ordered before the car arrives. The remaining 20% of delays are caused by unexpected additional work discovered during the job — which is unavoidable but now visible and managed.
Technician idle time
Technician downtime between jobs dropped significantly. Real-time status updates mean the next job is prepared before the current one finishes. The workshop manager no longer walks the floor to check bay status — it's on the screen.
Revenue impact
17 additional jobs per week at an average value of £250 translates to approximately £4,250 per week in additional revenue — or roughly £17,000 per month. Against a subscription cost of £139/month, the ROI is 122:1.
Key Takeaways
- Most garages have more capacity than they use. A 5-bay garage running at 64% utilisation is effectively a 3-bay garage. The space is there — it's the scheduling that's missing.
- Bay-level visibility changes booking behaviour. When the receptionist can see exactly which bays have gaps, they fill them. When all they see is a whiteboard list of jobs, the gaps are invisible.
- Duration-based scheduling prevents cascading delays. Booking a 4-hour job into a 2-hour slot doesn't just affect that bay — it pushes every subsequent job back. Accurate time estimates prevent the domino effect.
- Parts pre-ordering is a scheduling issue, not a stock issue. A bay sitting idle for 40 minutes while a part is delivered is a scheduling failure, not a stock failure. Linking parts to bookings fixes it.
- The cheapest way to increase revenue is to use what you already have. 17 extra jobs per week with no additional staff, no additional equipment and no additional overhead. The capacity was always there — it just needed to be visible.