The Situation
Fraser manages a 4-bay garage in Edinburgh with four full-time technicians. Each technician is paid for 40 hours per week — 160 paid hours across the team. The question Fraser had never been able to answer was simple: how many of those 160 hours are actually being billed to customers?
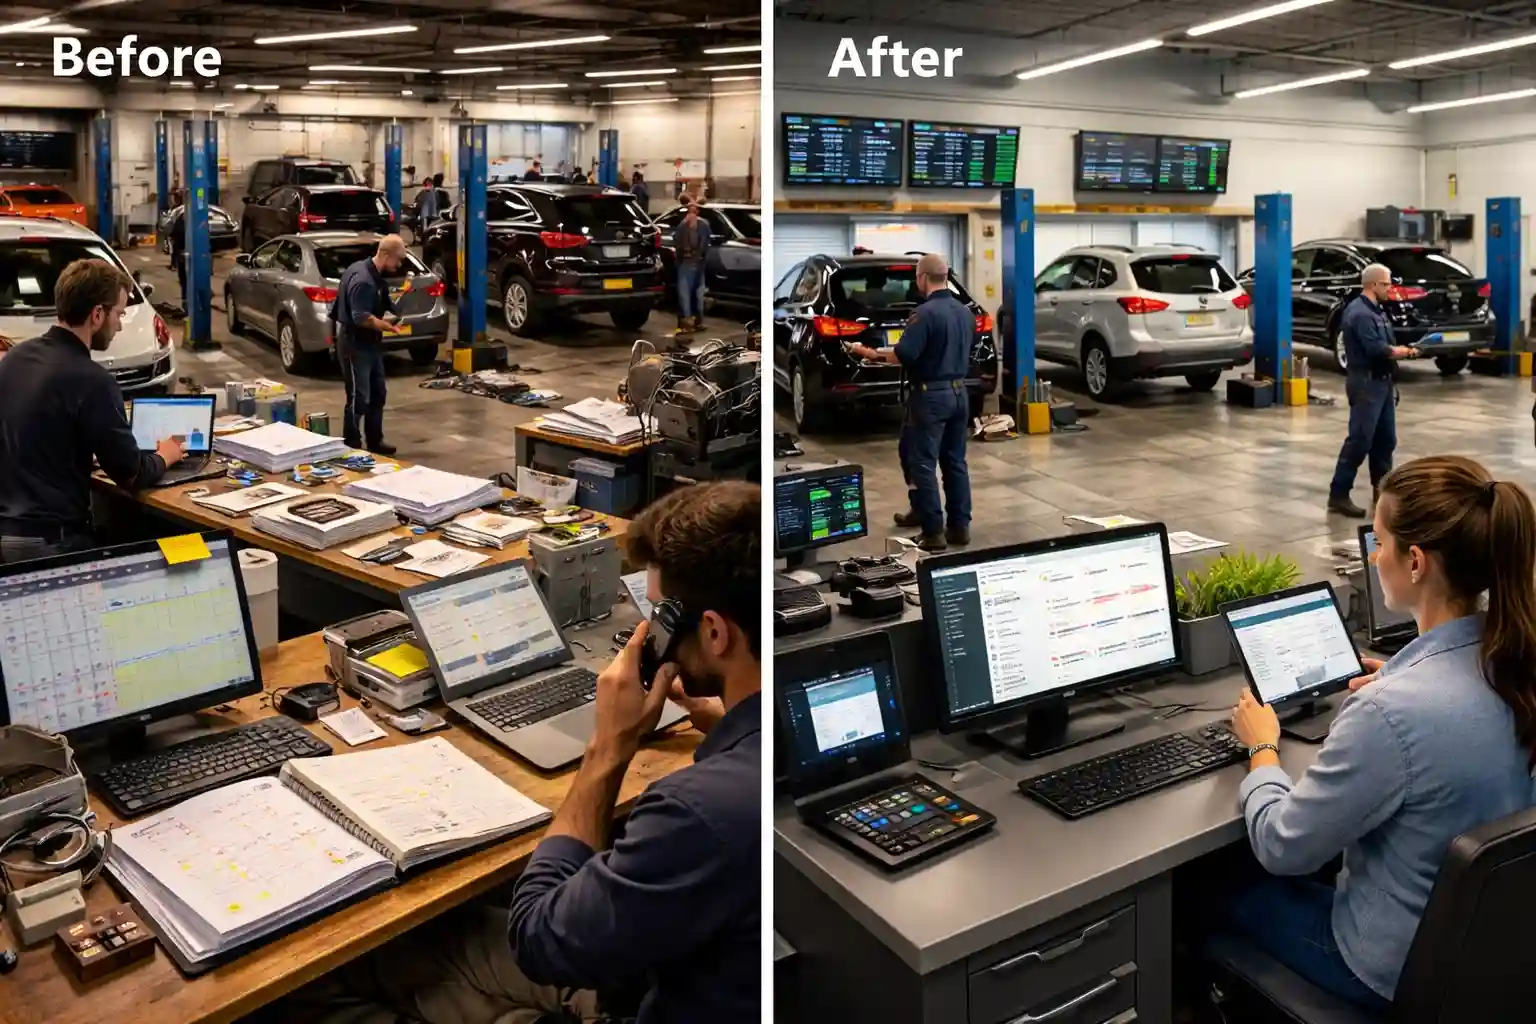
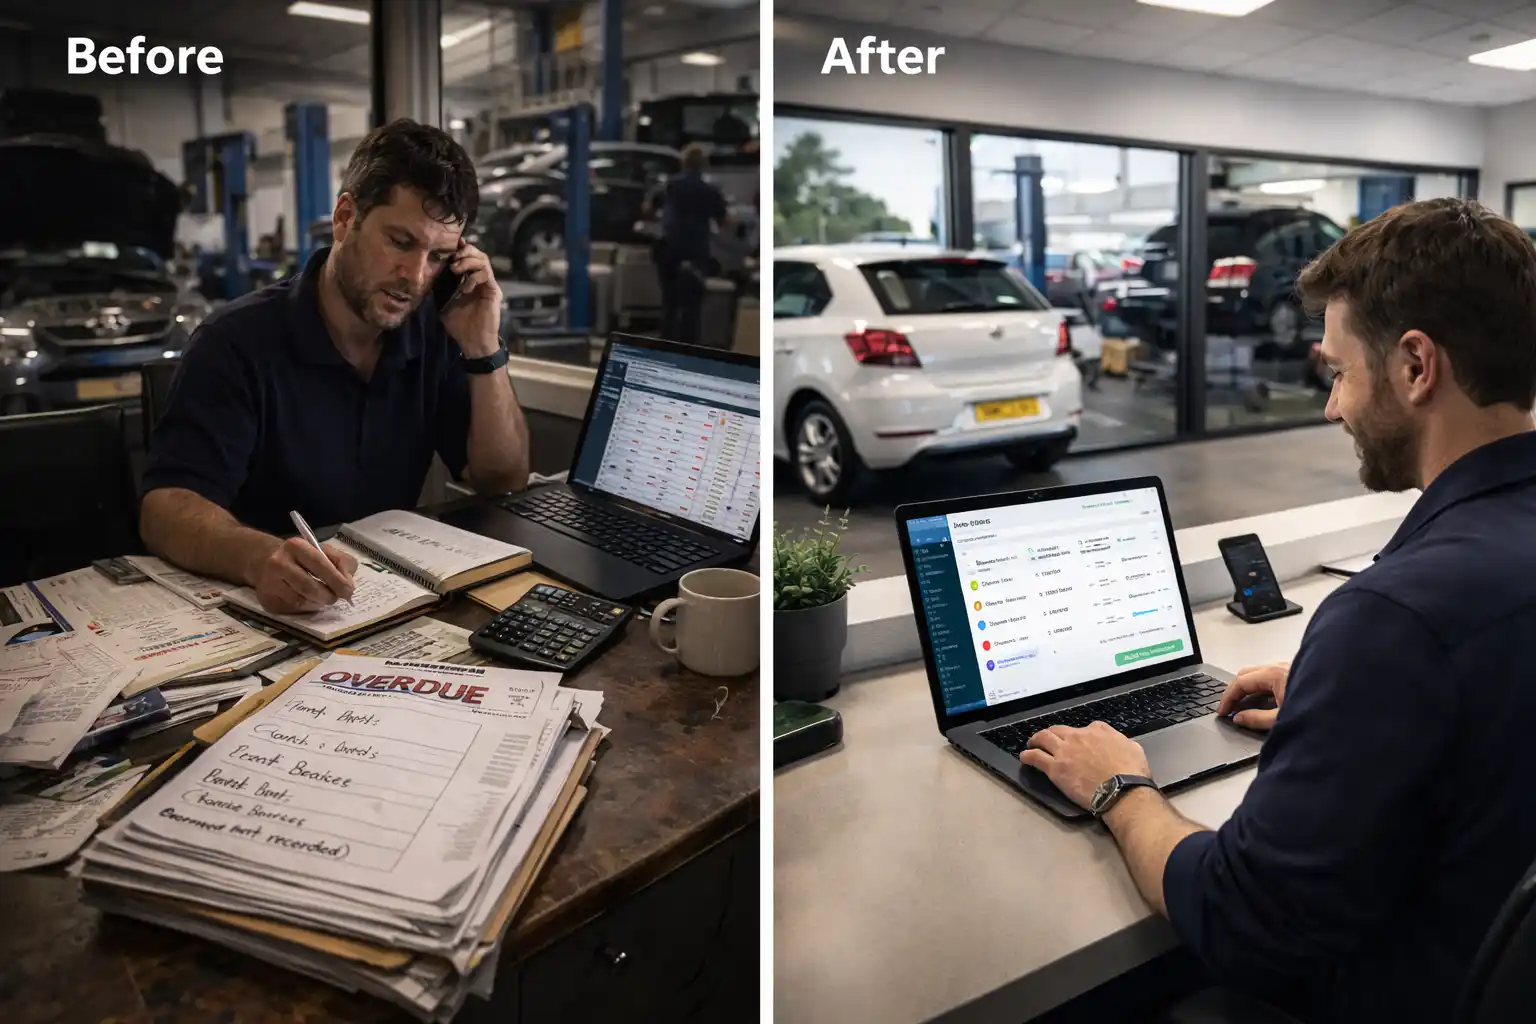
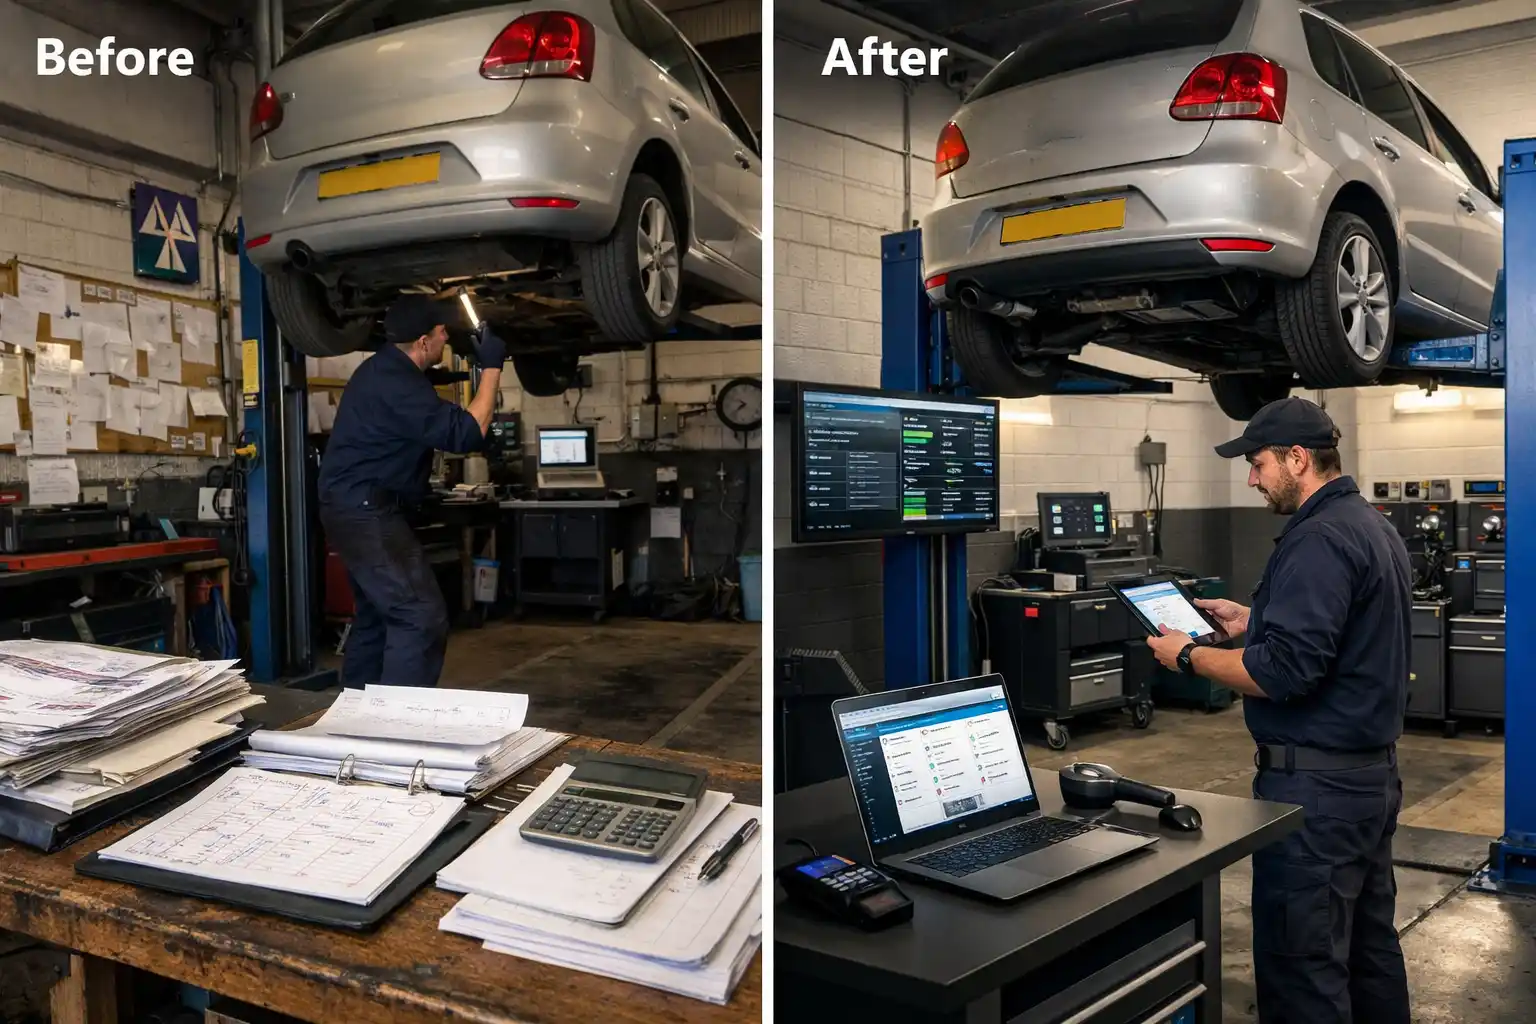
Before My Garage CRM, there was no time tracking. Job cards showed what work was done but not how long it took. Labour on invoices was estimated — a full service was billed at 1.5 hours regardless of whether it actually took 1 hour or 2.5 hours. The gap between hours paid and hours billed was invisible.
The Problem
Without time tracking, every staffing and pricing decision was based on guesswork:
- No visibility of billed vs paid hours — Fraser knew what he paid in wages and what he invoiced in labour. The gap between the two was a single number with no breakdown by technician, job type, or time of day.
- Flat-rate invoicing hid real costs — a full service billed at 1.5 hours whether it took 1 hour or 3. If a technician consistently took longer on a specific job type, the labour charge didn't reflect the actual time.
- No per-technician performance data — all four technicians were assumed equally productive. There was no way to identify who was efficient, who was struggling, and who needed different work allocated.
- Downtime invisible — time between jobs, waiting for parts, tea breaks, vehicle collection delays — none of it was captured. It simply disappeared into the gap between paid hours and billed hours.
- Scheduling done by gut feel — job allocation was based on who was available, not who was fastest at a particular job type. A technician who took 3 hours on a timing belt was allocated the same jobs as one who did it in 1.5.
Week 1 — The Baseline
My Garage CRM's time tracking was activated on all job cards. Technicians clock on and off each job using a tablet in the workshop. The system records actual time spent per job, per technician, automatically.
The first week's data revealed the efficiency gap:
| Metric | Week 1 — Actual |
|---|---|
| Total hours paid | 160 hours |
| Total hours billed to customers | 110.4 hours |
| Efficiency gap | 49.6 hours (31%) |
Of the 160 hours Fraser paid for, only 110.4 were being invoiced to customers. The remaining 49.6 hours — nearly a third of total paid time — were consumed by non-billable activity.
Per-Technician Breakdown
The data also revealed that the gap wasn't evenly distributed. Each technician had a different efficiency profile:
Craig was operating at 85% — close to the industry benchmark for an efficient independent garage. Jamie and Kev sat in the mid-70s — reasonable but with room for improvement. Ross was at 46% — less than half his paid hours were being billed. The gap was immediately visible.
Where the Time Was Going
The time tracking data also captured non-billable time categories. After two weeks, Fraser could see exactly where the unbilled hours went:
- Waiting for parts (11.2 hrs/week) — parts not pre-ordered, technicians standing idle while deliveries arrived. The single largest source of lost time.
- Between-job gaps (8.4 hrs/week) — time between completing one job and starting the next. No real-time status updates meant the next job wasn't prepared until the technician walked to the desk.
- Rework and comebacks (6.8 hrs/week) — jobs that came back with the same fault or needed additional correction. Almost entirely concentrated on one technician.
- Customer collection delays (5.6 hrs/week) — cars finished but not collected, blocking bays. No automated "your car is ready" notification meant customers collected when they remembered.
- Breaks and admin (17.6 hrs/week) — legitimate non-billable time. Tea breaks, cleaning, admin. This number was expected and consistent across all technicians.
What Changed
Parts pre-ordering
Parts are now linked to bookings and ordered before the car arrives. Parts waiting time dropped from 11.2 hours/week to 2.8 hours/week within three weeks.
Real-time job status
Technicians update job status on tablets. The next job is prepared while the current one is finishing. Between-job gaps reduced from 8.4 hours/week to 4.1 hours/week.
Automated collection notifications
Customers now receive an automated SMS the moment their car is marked complete. Collection delays dropped from 5.6 hours/week to 2.1 hours/week — bays are freed faster.
Targeted coaching for Ross
The data showed Ross's low efficiency was primarily caused by rework — his comeback rate was significantly higher than the other three technicians. Fraser identified the specific job types causing issues (brake jobs and wheel bearings) and paired Ross with Craig for supervised work on those tasks. Ross's efficiency improved from 46% to 62% over 8 weeks, with rework hours dropping by more than half.
Results After 8 Weeks
| Metric | Week 1 | Week 8 | Change |
|---|---|---|---|
| Hours paid | 160 | 160 | — |
| Hours billed | 110.4 | 133.4 | +23 hrs (+18%) |
| Efficiency | 69% | 83% | +14 points |
| Parts wait time | 11.2 hrs | 2.8 hrs | −75% |
| Rework hours | 6.8 hrs | 2.9 hrs | −57% |
Before and After
❌ Before
- No time tracking — hours estimated
- Flat-rate invoicing regardless of actual time
- No per-technician efficiency data
- 31% gap between paid and billed hours
- Parts delays invisible — 11.2 hrs/week lost
- Rework concentrated on one technician — undetected
- Job allocation based on availability, not skill match
✅ After
- Clock-on/clock-off per job via tablet
- Actual time tracked — pricing adjustments made
- Per-technician efficiency visible weekly
- Gap closed to 17% — 83% overall efficiency
- Parts pre-ordered — wait time down 75%
- Rework identified and addressed with coaching
- Jobs allocated by technician strength and speed
Key Takeaways
- You can't improve what you don't measure. Fraser suspected inefficiency for years. The moment he had data, the problems were obvious and the fixes were straightforward. Without measurement, every decision was a guess.
- The efficiency gap is always larger than you think. 31% of paid hours not being billed — nearly a third of the entire wage bill producing zero revenue. Most garage owners estimate their gap at 10–15%. The real number is almost always worse.
- The gap isn't caused by lazy technicians. The majority of unbilled time was caused by waiting for parts, between-job gaps and collection delays — systemic problems, not personal ones. Fixing the system fixed the gap.
- Per-technician data enables targeted action. Three of four technicians were performing reasonably well. One had a specific rework problem on specific job types. Without individual data, Fraser would have applied a blanket approach that missed the actual issue.
- The revenue impact is immediate and permanent. 23 extra billed hours per week at £75/hour is £1,725 per week — £89,700 per year. Against a £139/month subscription, the annual ROI exceeds 500:1.