The Situation
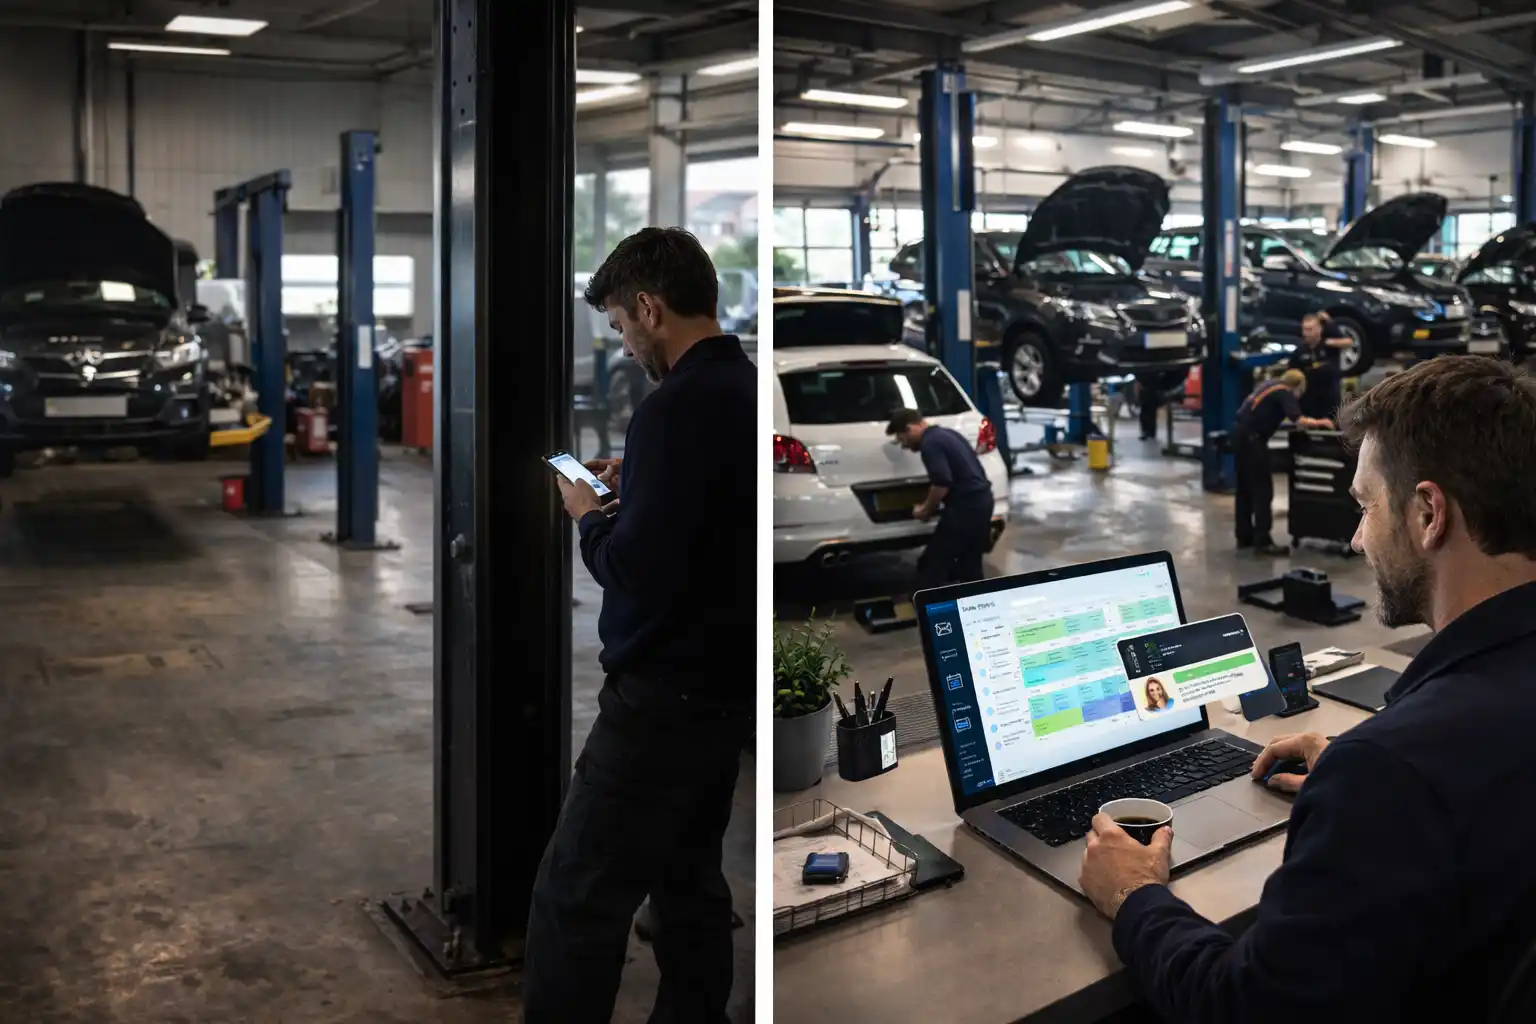
Mark runs a 5-bay independent garage on the outskirts of a Yorkshire market town. The business turns over approximately £540,000 a year across MOTs, servicing, repairs, diagnostics and tyres. He employs three full-time technicians and a part-time receptionist. The garage is well-regarded locally — 4.7 stars on Google, decent stream of word-of-mouth referrals, no real reputation issues.
The labour rate, however, hadn't been reviewed in over three years. £68 per hour, set when one of the technicians was still an apprentice and minimum wage was lower. Energy costs had risen, technician wages had risen, parts margins had compressed — and the rate had stayed exactly where it was. Mark suspected he was undercharging. He didn't realise by how much.
The Trigger
Two things prompted the review. The lead technician asked for a £2,500 pay rise to keep pace with what nearby franchise dealers were paying their staff. And the year-end accounts showed owner take-home had dropped by roughly £8,000 over the previous two years despite turnover being broadly flat — a slow squeeze that had crept up bill by bill.
Mark sat down with a spreadsheet, his most recent quarterly P&L, and the cost-breakdown framework set out in our companion article on UK garage labour rates. The exercise took about ninety minutes and produced an answer that genuinely surprised him.
The Cost Analysis
Here's what every £68 of the old hourly rate was actually paying for, mapped against where every £85 of the new rate now goes:
The "owner take" line is the one that landed. At £68 per hour, after every fixed cost was covered, Mark was netting roughly negative 60 pence per billed hour — meaning the business was technically loss-making at the labour line, and was only profitable because of parts margin and MOT volume. The new rate of £85 produced a £10 owner-take per billed hour, comfortably funding both his own salary and a £2,500 raise for the lead technician.
Why £85 (Not £75 or £95)
The instinct for many garage owners is to soften a rate rise — go to £75, see what happens, then push on if customers don't object. Mark consciously avoided that approach for two reasons. First, £75 still left him with a thin owner take and no headroom to give the lead technician the rise they'd asked for, which would mean another rate review within six months. Second, two small increases feel suspicious to customers in a way that one well-communicated jump doesn't.
£85 was selected because it landed comfortably in the regional range for Yorkshire independents (£60–£85 according to industry surveys), funded the technician pay rise immediately, restored a healthy owner take, and gave roughly two years of headroom before the next review would be due. It was also the figure the cost analysis pointed to as actually paying for the business — not a stretch goal, just the maths.
The Rollout — 8 Weeks, No Drama
The rate change was rolled out over eight weeks rather than overnight, deliberately designed to give existing customers fair warning and the team time to adjust. The structure was simple:
- Week 1 — Internal alignment. Mark briefed the technicians and receptionist. The receptionist needed talking points for any questions; the technicians needed to know that the rise was funding their own pay rises and a planned investment in diagnostic equipment. Total team meeting time: about 45 minutes.
- Week 2 — Existing customers notified. A short email and SMS sent through My Garage CRM to all customers seen in the previous 12 months. Plain language, two paragraphs: rate moving from £68 to £85 from week 9, reasons (rising costs, equipment investment), no apology, no hedging.
- Weeks 3–8 — Quotes honoured at old rate. Anyone quoted before week 9 had their old rate honoured. Bookings already in the diary kept their original pricing. This removed every possible "but you said…" conversation.
- Week 9 — New rate live. Updated quote board on the wall, website pricing page refreshed, Google Business Profile description edited to reflect the new positioning. New customer enquiries quoted at £85.
What Happened — Customer Retention
The retention pattern was almost identical to what industry data predicts for a well-handled rate rise. 96% of customers continued to book at the new rate. The 4% who left were predominantly customers Mark could identify by name from the CRM history:
Customer retention 90 days post-rate change
The cohort that left was disproportionately weighted towards the customers Mark had quietly disliked dealing with for years. Two of them had previously been the subject of awkward "can you do it cheaper" conversations. The receptionist's comment, several weeks in, was that the day-to-day rhythm of dealing with customers had subtly improved — fewer price negotiations, more straightforward bookings. The 4% loss was effectively a feature.
Revenue Trajectory by Month
Monthly labour revenue — 6 months bracketing the rate change
Month 1 and 2 are the baseline at the old rate (~£24,900/month avg). Month 3 saw a small uptick from customers booking before the rate change took effect. Months 4 to 6 show the new rate in full operation, settling at approximately £32,000/month — an uplift of just over £7,000/month. Across the 6-month window, total labour revenue captured was £38,400 above what the old rate would have produced. The annualised run rate sits at approximately £77,000 per year.
Weekly Detail — Before and After
| Metric | Before (£68/hr) | After (£85/hr) | Change |
|---|---|---|---|
| Avg weekly billable hours | 87 | 84 | −3.4% |
| Avg weekly labour revenue | £5,916 | £7,140 | +£1,224 |
| Avg job invoice value | £284 | £331 | +£47 |
| Customer complaints (price-related) | ~2/week | ~1/week | −50% |
| Owner-take per billable hour | −£0.60 | £10.00 | +£10.60 |
| Net monthly profit (labour line) | −£200 | £3,360 | +£3,560 |
The 3.4% drop in billable hours reflects the small customer cohort that left. The £47 lift in average job invoice value, however, more than compensated — same workshop volume, more revenue per job, dramatically better profit margin per hour worked.
Where the New Margin Goes
Mark allocated the £77k annual run rate uplift across four areas — deliberately publicly within the team, so the technicians could see exactly where the money was being reinvested:
Lead technician pay rise
The original ask that triggered the rate review. Funded immediately, backdated to the start of the rollout. Retention conversation closed.
Owner salary uplift
Restored the £8,000 erosion of the previous two years and added comfortable headroom. Removed the personal financial pressure that had been quietly building.
Diagnostic equipment
New diagnostic platform with EV capability — a piece of kit that had been on the wishlist for two years. Funded outright in month 8 from the new margin.
Operating reserve + tax
Reinvestment, corporation tax/NIC on the higher take, and a genuine cash reserve for the first time in the business's history.
Before and After
❌ Before
- £68/hour — unchanged for 3+ years
- Owner take: −£0.60/billable hour
- Owner salary eroded by £8k over 2 years
- Lead technician asking for pay rise — couldn't fund it
- Diagnostic equipment investment deferred 2 years
- Frequent price-haggling conversations
- Net monthly profit on labour: −£200
✅ After
- £85/hour — comfortable in regional range
- Owner take: £10/billable hour
- Owner salary up £8k restored + £24k uplift
- Technician pay rise funded + backdated
- £12,500 diagnostic platform purchased outright
- Price haggling halved — chaser cohort gone
- Net monthly profit on labour: £3,360
Key Takeaways
- Anchor to your costs, not to the local average. The £68 rate was perfectly reasonable for the local market. It was nowhere near reasonable for Mark's actual cost base. Two different questions, two different answers — and the cost-based answer is the one that matters.
- One clean jump beats two creeping rises. Customers expect prices to move occasionally. They don't expect to feel they're being nudged upwards continuously. £68 to £85 in a single move generated less friction than two £8.50 rises six months apart would have done.
- The customers you lose tell you who you should have been losing all along. Mark's 4% churn was almost entirely customers who had been low-margin, time-consuming and confrontational on price for years. The "loss" was a positive selection event for the business, not a negative one.
- Communicate without apologising. The most successful rate-rise notifications are short, factual and forward-looking. Apology language signals doubt and invites pushback. "Our rate is £85 from May 1st" is the right tone.
- Reinvest visibly. Letting the team see exactly where the new margin was going (their own pay rise, the diagnostic platform, the cash reserve) made the rate change feel like an alignment exercise rather than an owner cash grab. Morale ended the year materially higher than it started.
For the full framework Mark used to set the rate, see our companion guide: Garage Labour Rates UK 2026: How Much Should You Charge Per Hour?.